
Observations

Space Based Imaging

More data: SWAP, EUI

Ground Based Imaging

More: H-α, WL, Ca-IIK, Drawings

Ground Based Radio

More: ARCAS+HSRS, CALLISTO

Space Based Timelines

More data: LYRA, TSI

WDC Sunspot Index

More data: SILSO

Space Weather Services

Detections

Solar Map

Latest Alerts

Presto 2024-05-09

An X1.1 flare has occurred with a peak time 17:44 UTC on May 09, produced by NOAA AR 3664. Type II and type IV radio emissions were detected at 17:32 UTC and 17:45 UTC, respectively, during the flaring activity. Currently, the GOES proton flux is slightly enhanced but remains below the 10 pfu threshold level. Moderately disturbed radio communications have been observed related to this flaring activity.

Flaremail 2024-05-09

A class X1.1 solar X-ray flare occurred on 2024/05/09 with peak time 17:42UT

CACTus Halo 2024-05-09

A halo or partial-halo CME was detected with the following characteristics: t0 | dt0| pa | da | v | dv | minv| maxv| 2024-05-09T09:24:07.479 | 2.0 | 253 | 184 | 919 | 338 | 372 | 1893 t0: onset time, earliest indication of liftoff dt0: duration of liftoff (hours) pa: principal angle, counterclockwise from North (degrees) da: angular width of the CME (degrees), v: median velocity (km/s) dv: variation (1 sigma) of velocity over the width of the CME mindv: lowest velocity detected within the CME maxdv: highest velocity detected within the CME

Forecasts

  • Flare: X-class flares
    (≥50%)
  • Protons: Quiet
  • Geomagnetic: Quiet
    (A<20 and K<4)
  • All quiet: False
  • Provisional SSN: 170

Solar Activity

URSIgram 2024-05-09

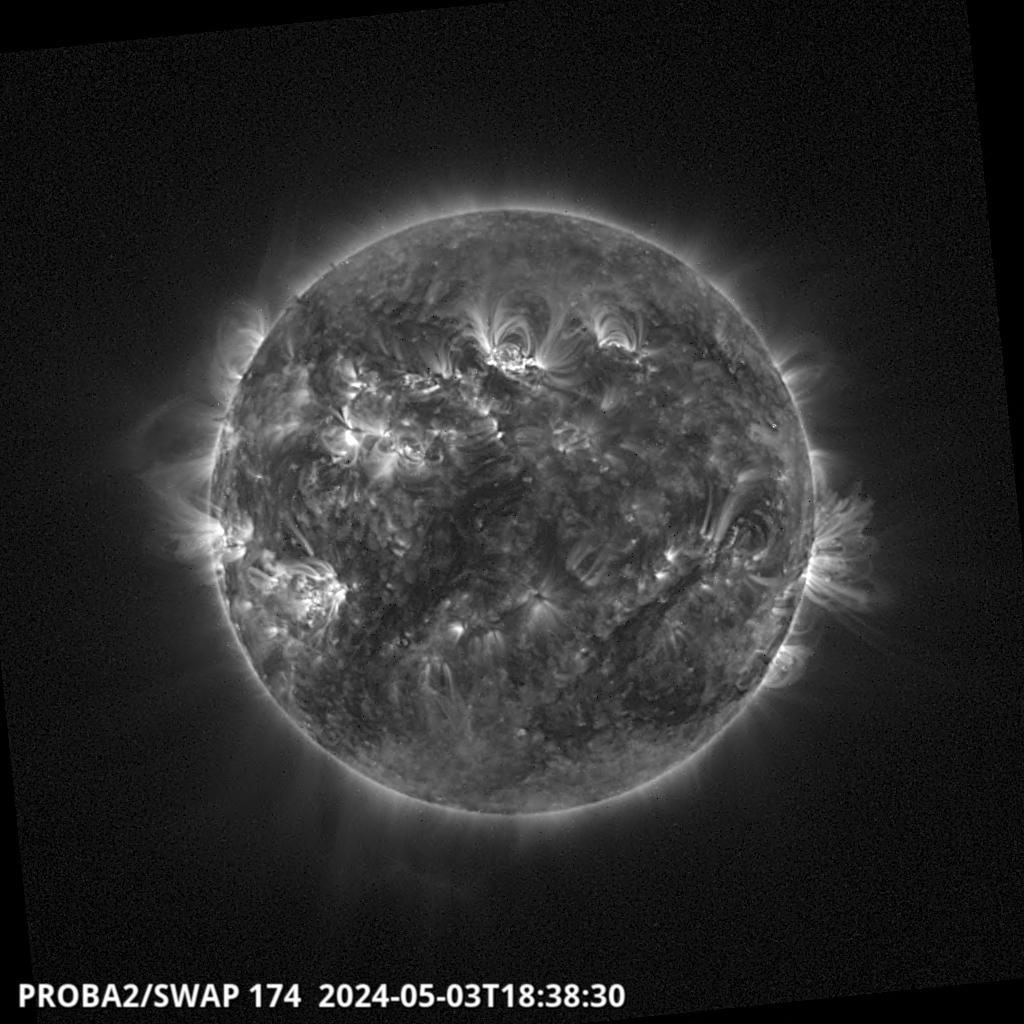
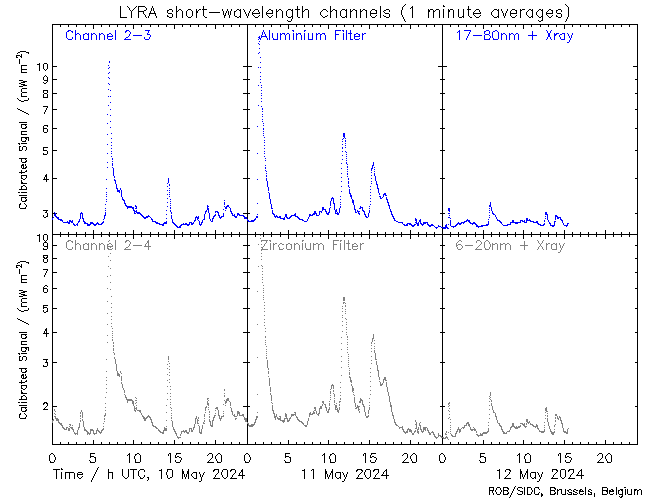
The solar flaring activity was at very high levels with several M-class flares and two X-class flares during the last 24 hours. The strongest reported flare was GOES X2.3 flare which peaked at 09:13 UTC on May 09, produced by NOAA Active Region (AR) 3664. During the flare, source region (AR 3664) of the flare had beta-gamma-delta configuration of its photospheric magnetic field. The solar flaring activity is expected to be at high to very high levels over the next 24 hours possibly with several M-class flares and chance for X-class flare. 
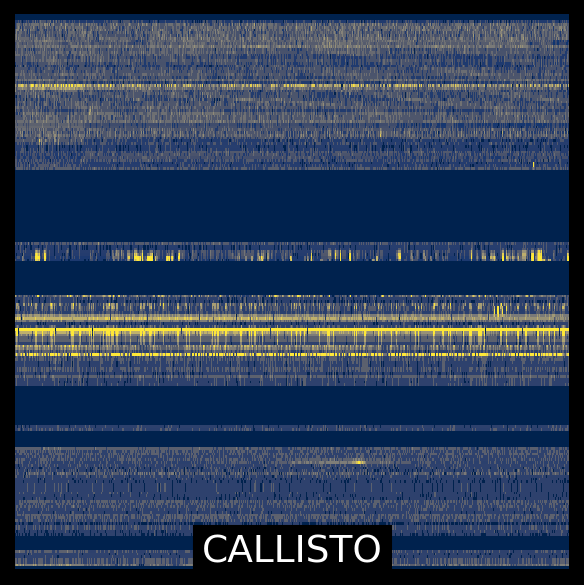
A halo coronal mass ejection (CME) was observed on SOHO/LASCO-C2 images starting around 12:48 UTC on May 08. This halo CME is associated with a M8.7 flare, which peaked at 12:04 UTC, produced by NOAA AR 3664. With its source region closer to the central meridian and with a projected speed of about 446 km/s (as measured by the Cactus tool), the corresponding ICME is expected to impact the Earth on May 11. A narrow CME (about 70 deg width) was observed on the NE limb around 19:24 UTC on May 08, which is possibly associated with a filament eruption around 18:30 UTC (below NOAA AR 3667). It has projected speed of about 440 km/s, as detected by CACTUS tool. Only a glancing blow, associated with this CME, can be expected at the Earth late on May 11 or early on May 12. Another partial halo CME was first observed on SOHO/LASCO-C2 images around 22:36 UTC on May 08. This CME is associated with a X1.0 flare, which peaked at 21:40 UTC, produced by NOAA AR 3664. It has a projected width of about 184 deg and a projected speed of about 552 km/s (as measured by the Cactus tool). With its source region closer to the central meridian, the corresponding ICME is expected to impact the Earth late on May 11 or early on May 12. An X2.3 flare occurred with a peak time 09:13 UTC on May 09, produced by NOAA AR 3664. Associted Type II and type IV radio emissions were detected at 09:02 UTC and 09:10 UTC, respectively, during the flaring activity. Corresponding EUV wave is also observed on SW quadrant of the Sun. The associated CME will possibly have Earth directed components. Further analysis will be carried out once thecorresponding LASCO images are availble. Two coronal holes (CH) has started to cross the central meridian on May 8, with one CH spanning 0 N - 40 N (positive polarity) and another CH spanning 29 S - 43 S (negative polarity). The solar wind from these coronal holes may enhance the solar wind environment near Earth on May 11. The greater than 10 MeV GOES proton flux was below the threshold level over the past 24 hours and is expected to remain so for the next 24 hours. The greater than 2 MeV electron flux, as measured by the GOES-16 satellite, was below the threshold level over the past 24 hours and is expected to remain so in the coming 24 hours. The 24h electron fluence is presently at normal level and is expected to remain so for the next 24 hours.

Solar Wind

URSIgram 2024-05-09

Geomagnetic conditions were globally at quiet (NOAA Kp 1 to 2) and locally at quiet to unsettled conditions (K BEL 1 to 3). Quiet to unsettled conditions are expected in the next 24 hours. Solar wind parameters are transitioning from fast to slow solar wind regime. The solar wind speed ranged from 490 km/s to 425 km/s. The North-South component (Bz) ranged between -3 and 3 nT. The interplanetary magnetic field ranged between 1 nT and 4 nT. We expect a transition to slow solar wind regime in the next 24 hours.

Research

News

X-class festival continues!

The high solar flare activity continues as NOAA 3664 has joined the party. ***UPDATED***

The show continues!...

NOAA 3663 produced its 4th and -so far- strongest X-class flare on 6 May.

X-class flares!

Active region NOAA 3663 produced an X1.6 flare early on 3 May. Further M-class flaring can be expected from this sunspot group, with a chance on another X-class flare. ***UPDATED (2)***
 

Activities

Ground Observations

The SIDC monitors the level of solar activity from the photosphere to the corona with ground based instruments located in Uccle and Humain.

Read more

Space Instruments

To avoid the disturbing or blocking effect of the Earth atmosphere, EUV observations of the solar corona need to be made from space...

Read more

Space Weather & Climate

We monitor and forecast solar variability to provide information services  to society and industry about the influence of space weather and climate.

Read more

Data Processing & Distribution

Data processing is necessary to extract relevant information for research studies, whereas data distribution and visualization are part of ROB open data policy.

Read more

Modeling

Modelling of Solar phenomena allows scientists to test theories and to predict Space Weather phenomena and their impact on Earth.

Read more


Supporting Research

The SIDC shares and expands its expertise through interaction with both upcoming and experienced researchers.

Read more